Introduction
A GPC is an essential instrument for polymer synthesis. The operating principle of a GPC is that injected molecules are sorted by size using a porous media (the columns) with constant eluent (solvent) flow. Larger molecules pass more quickly through the columns since they fit into a small fraction of the pore sizes whereas smaller molecules take longer to exit the columns since they fit into most of the pore sizes and thus experience more delay. The molecular size distribution thus determines the time-dependent rate of molecules exiting the columns. Detectors are used to measure the stream of molecules exiting the columns in order to quantify the molecules. Most GPCs include a refractive index (RI) detector in part because they can detect nearly any polymer as long as its RI is different from the RI of the solvent phase. One of the challenges of RI detectors is that “they detect everything” including dissolved gases and temperature changes. Thus the eluent is often degassed by ultrasonication or by sparging with helium periodically and GPC columns are oftentimes maintained at a slightly elevated temperature for consistency sake.
Let’s Build a Simple GPC
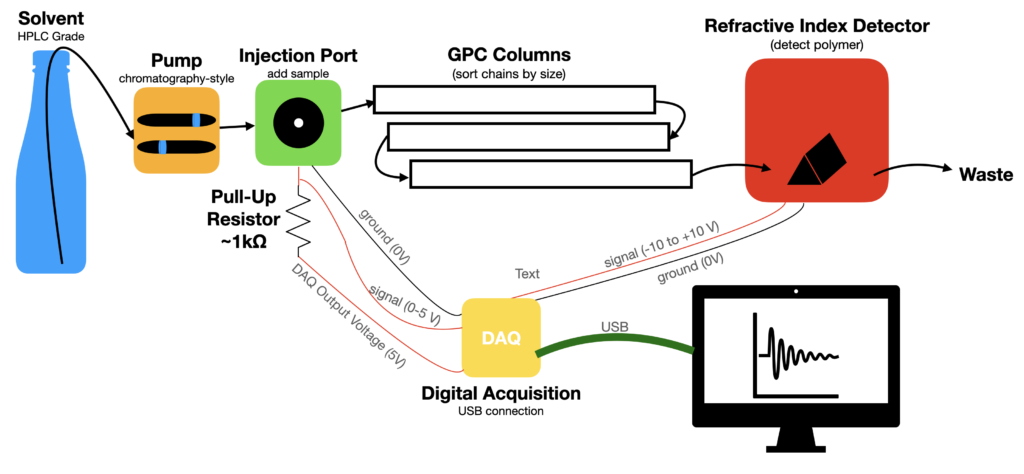
The essential elements are laid out below from left-to-right. HPLC grade solvent (often THF) is usually used for the eluent. Do be sure to degas the solvent, e.g. by ultrasonication for 30 min every few months. Fancier setups use in-line degassing continuously, but the point here is minimum complexity and minimum operating cost. A chromatography style pump is appropriate to drive the eluent phase. Usually these pumps drive ~1 mL/min through the columns and require a pressure of ~500-1,000 psi to do so. Pressure fluctuations and leaks cause inconsistent data so if you buy a used pump it is advisable to service the pump seals. The pump mechanics usually include two cylindrical displacement drives to maintain relatively constant flow and pressure. The injection port allows the eluent to pass by when not in use. The injector port also has a bypass line that you can load a sample solution into and then let the sample carry on down the line to the columns. The columns are arguably the heart of the GPC where all the size-sorting takes place. GPC columns are highly optimized and complex where each column has an optimized range of pore sizes to sort a range of molecular masses. That being said, many GPC columns are from another perspective glorified packing-peanuts with some cross linking (If you have some procedures for DIY columns, then please let me know). From the columns, the eluent stream passes on to the detector(s) and computer read out and analysis. There are lots of elegant detector designs that each bring distinct advantages and benefits in certain scenarios, but we are rather here to talk about building a bare-bones GPC for routine work.

Budget Parts Selection
- ~free – Solvent Bottle. Use the bottle your solvent was delivered in, just drill a small hole in the cap for the tube to pass through
- ~$300-500 – HPLC Pump. Waters 515 and Shimadzu LC-10AD are widely available used on eBay and other marketplaces. Often these should be serviced before use, e.g. replacing the gaskets, to make sure there is consistent pressure and flow rate during use.
- ~$50-100 – HPLC Injection Port. There are many options available, just be sure to select one with a switch integrated so that the injection time can be monitored. If there are 2 electrical connections (or 2 wires) then you are probably all set.
- $4,000-6,000 – GPC Columns. Usually 3 separation columns and 1 guard columns are used. The guard column is there to protect the columns from clogs (i.e. clog the guard and replace it as needed). The columns are usually each selected to sort a different range of molecular masses, choose according to your needs. For some steel tubes filled with polystyrene, this is obviously a place where there is potential for huge savings if some bright person out there can come up with DIY columns.
- $500-1000 – RI Detector. Waters 2414/2415 detectors are widely available used, as well as many other smaller vendors I am less familiar with. I suggest choosing a model with an LED light source for longevity and consistency sake; those with light bulbs need to be turned on/off between uses, thus needing equilibration time and eventual lightbulb replacements.
- $5-$500 – DAQ. MCC DAQ makes excellent low-cost DAQs and National Instruments is the gorilla in the room with excellent DAQs and support along with the associate higher costs. The DAQ records the electrical signals from the injection port and the RI detector for analysis. It is essential that the DAQ match the recording needs of your detector. For example if your detector outputs signal from -10 to +10V then your DAQ needs to be able to record that. If you want say ~10,000 points of vertical scale with this example, then your DAQ needs to have a resolution of 20 V / 10,000 pts = 20mV/pt. If your RI detector outputs say 0-5V then you may be able to get away with an Arduino UNO for acquisition (5 V / 1024 pts = 4.9 mV/pt. I selected a MCC DAQ 230 Series with +/-10V range and 16bits of resolution. That corresponds to 20 V / 2^16 pts = 0.3 mV/pt. All 3 options noted here have USB interfaces and good MATLAB integration if you want to adapt my software posted below.
- ~free – Computer. Basically any computer that functions is sufficient for this task.
Software
I asked a vendor for a GPC software quote, hoping to save some effort, and got a whopping $15k estimate. I think we can do a bit better on budget here, how hard could it be to convert timing to mass? I wrote three software modules to support the basic GPC tasks 1) Acquisition, 2) Analysis, and 3) Calibration.
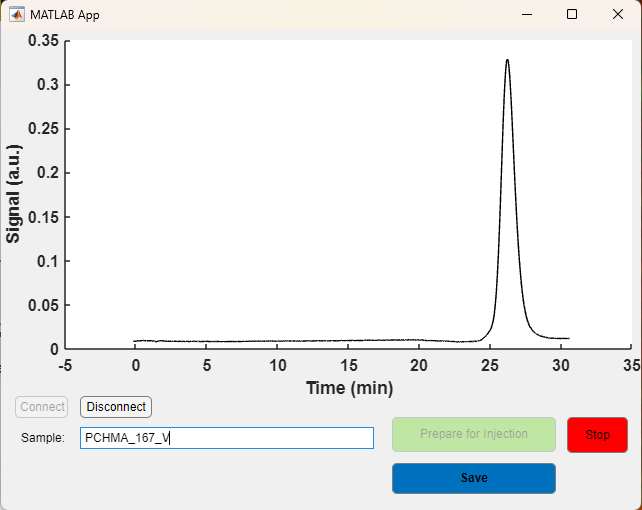
The Acquisition Module is used by 1) initiating communication with the DAQ, 2) starting to receive the signal, 3) naming the sample, 4) injecting the sample, and 5) recording the output. The software then essentially records the voltage signal from the RI detector over time and saves that along with the measured time since the injection signal. You may need to adjust the curve smoothing and noise suppression parameters. For our setup, we chose to over-sample the signal 5,000 pts/s and then down-sample to 1 pt/s. We had the most reliable and fast timing by using the DAQ in a streaming mode rather than polling point by point.

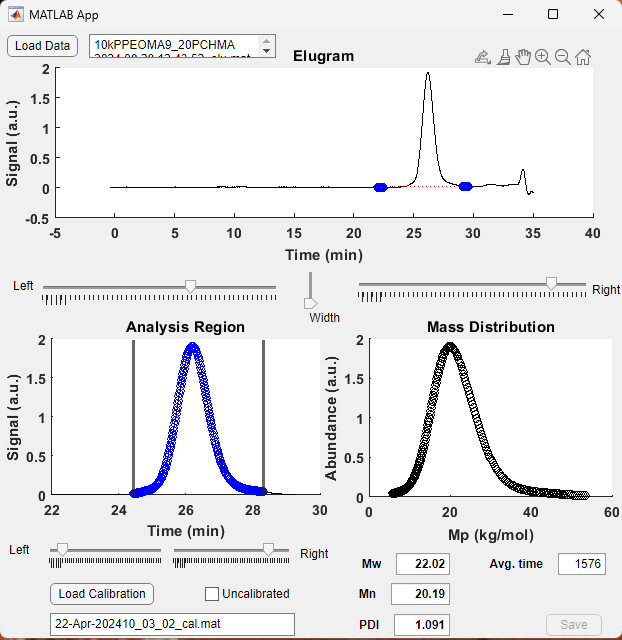
The Analysis Module opens the files saved by the Acquisition Module. Usage includes 1) load data, 2) set baseline left bound, right bound, and width, 3) set left and right bound of analysis, 4) Load calibration or run uncalibrated, 5) Save output. When first setting up your GPC, the first task will probably be calibration that correlates elution time to molecular mass. When used in “uncalibrated mode” then this module reports the center-of-mass of the selected peak (representative elution time).

After your calibration curve is prepared (next section) this Analysis Module also lets you determine the molecular mass statistics of your polymer. After loading a calibration curve you will see that the bottom right plot switches to having an x-axis of molecular mass. The corresponding weight-average molecular mass is reported (Mw) along with what old timers call the “polydispersity index (PDI)”, nowadays more properly called the “molar-mass dispersity index.”

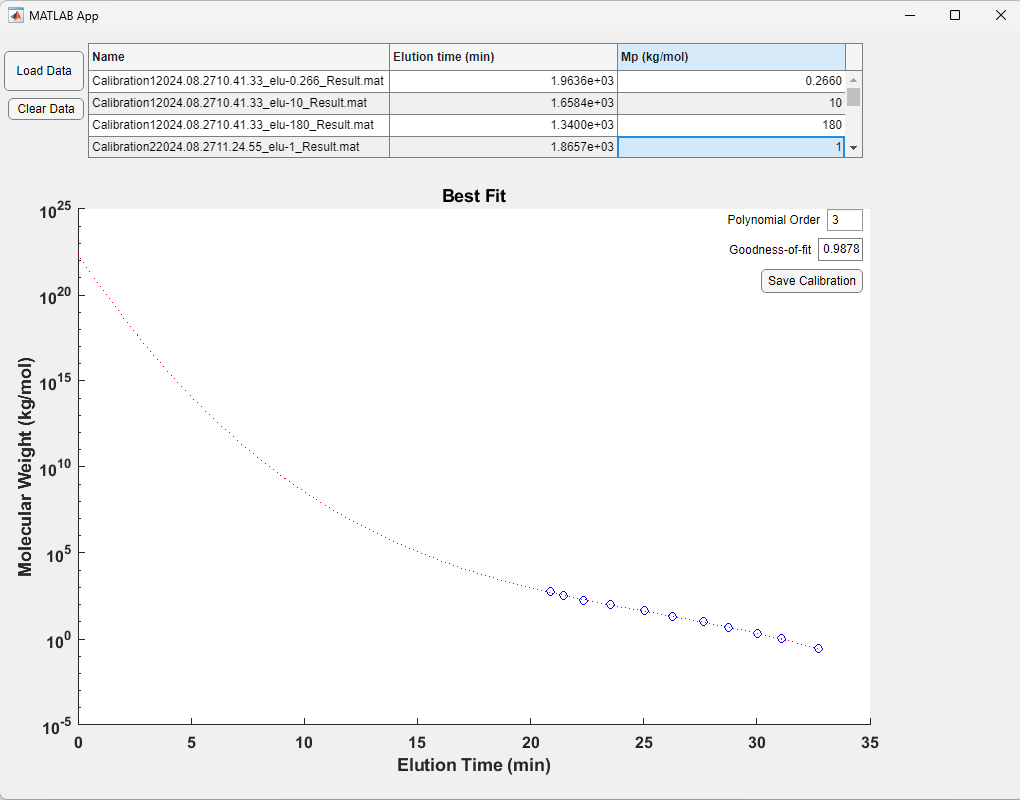
The Calibration Module enables the production of calibration curves using a series of “uncalibrated” measurements saved by the Analysis Module. Usage is 1) Load data, 2) enter the known Mp for each calibration sample that was run, 3) choose a fit function polynomial order and 4) save the calibration file for use in the Analysis Module. The fit function should be chosen based on the polynomial order and goodness-of-fit such that the fit curve is monotonic (i.e. slope must be negative at all points!), fitting well, and not too many steep changes in derivative. Fitting is clearly subjective and often has ~5-10% error at some points.

MATLAB App Files
Alpha release (active improvements ongoing), including Acquisition Module (MCC DAQ), Analysis Module, and Calibration Module.
Acknowledgements
We kindly thank the Hanse-Wissenschaftskolleg for support of this project.

